Fact Sheets and Other Statistical Profiles
- College Navigator profile
- Institutional data reported on federal IPEDS surveys
- U.S. Department of Education College Scorecard profile
- Academic Fact Sheet 2025-26
- Academic Fact Sheet 2024-25
- Academic Fact Sheet 2023-24
- Academic Fact Sheet 2022-23
- Academic Fact Sheet 2021-22
- Academic Fact Sheet 2020-21
- Academic Fact Sheet 2019-20
- Academic Fact Sheet 2018-19
- Academic Fact Sheet 2017-18
- Academic Fact Sheet 2016-17
Common Data Sets
- Common Data Set 2025-26
- Common Data Set 2024-25
- Common Data Set 2023-24
- Common Data Set 2022-23
- Common Data Set 2021-22
- Common Data Set 2020-21
- Common Data Set 2019-20
- Common Data Set 2018-19
- Common Data Set 2017-18
- Common Data Set 2016-17
Faculty, Student and Staff Demographic Data
- Faculty Student and Staff Demographic Summary fall 2025
- Faculty Student and Staff Demographic Summary fall 2024
- Faculty and Student and Staff Demographic Summary fall 2023
- Fall 2022 Faculty, Student and Staff Demographic Summary
- Fall 2021 Faculty and Student Demographic Summary
- Fall 2020 Faculty and Student Demographic Summary
- Fall 2019 Faculty and Student Demographic Summary
- Fall 2018 Faculty and Student Demographic Summary
- Fall 2017 Faculty and Student Demographic Summary
| Percent of full-time, degree-seeking undergraduates | ||||||||||
|---|---|---|---|---|---|---|---|---|---|---|
| Fall 2016 | Fall 2017 | Fall 2018 | Fall 2019 | Fall 2020 | Fall 2021 | Fall 2022 | Fall 2023 |
Fall 2024 |
Fall 2025 |
|
| Gender | ||||||||||
| Women | 63% | 63% | 62% | 62% | 62% | 59% | 62% | 61% | 61% | 61% |
| Men | 37% | 37% | 38% | 38% | 38% | 41% | 38% | 39% | 39% | 39% |
| Race and ethnicity | ||||||||||
| White | 70% | 71% | 70% | 67% | 67% | 67% | 67% | 69% | 68% | 66% |
| U.S. students of color† | 20% | 20% | 21% | 22% | 23% | 23% | 23% | 24% | 24% | 26% |
| Unreported race/ethnicity | 3% | 1% | 2% | 2% | 1% | 2% | 2% | 2% | 2% | 2% |
| U.S. Nonresident | 7% | 7% | 7% | 9% | 8% | 9% | 8% | 6% | 6% | 6% |
Source: IPEDS Fall Enrollment Survey.
† Includes the following categories: American Indian or Alaska Native, Asian, Black or African American, Hispanic, Native Hawaiian or Other Pacific Islander, Two or more races.
| Percent receiving a Federal Pell Grant | |||||||||||
|---|---|---|---|---|---|---|---|---|---|---|---|
| 2015-16 | 2016-17 | 2017-18 | 2018-19 | 2019-20 | 2020-21 | 2021-22 | 2022-23 | 2023-24 | 2024-25 | 2025-26 | |
| All undergraduates | 15% | 16% | 17% | 16% | 13% | 16% | 16% | 15% | 14% | 18% | 17% |
| Full-time, first-time, degree-seeking undergraduates | 17% | 17% | 14% | 16% | 15% | 17% | 15% | 13% | 14% | 20% | 18% |
Source: IPEDS Student Financial Aid Survey.
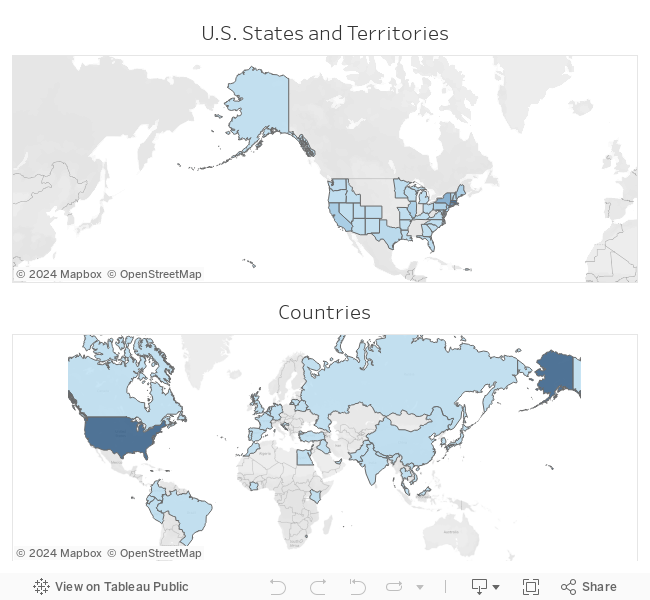
Student Geographic Origins
In Fall 2024, based on their permanent addresses on file with the College, our full-time undergraduates came from 45 states and the District of Columbia, and 46 foreign countries.